

GAS CHROMATOGRAPHY / MASS SPECTROMETRY
Gas chromatography-mass spectrometry (GC-MS) is a hyphenated technique; consisting of two analytical procedures in sequence, namely a Gas Chromatography (GC) separation followed by Mass Spectroscopy (MS) detection. The purpose of the GC step is to separate multiple compounds in a sample so that they reach the MS detector one at the time. The GC uses a high-resolution fused silica capillary column housed in a temperature-controlled oven. The capillary column contains a stationary phase; a fine solid support coated with a nonvolatile liquid. The solid can itself be the stationary phase.
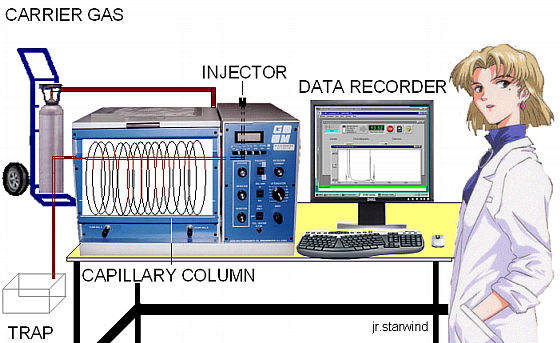
Schematic diagram of the GC-MS instrument.
When a sample solution is introduced into the injection port it is vaporized immediately because of the high temperature (up to ~300 0C) and low pressure (~10-4-10-7 torr). The sample is conveyed through the length of the tubing by a carrier gas or mobile phase. As the components of the sample travel through the column, they interact to varying degrees with the stationary phase depending on their affinity for this material. As a result, different compounds will travel with different speeds through the capillary tubing and will exit from the column after a distinct retention time. The temperature of the oven containing the capillary column can be controlled to optimize the separation. When the mobile phase passes through the detector, a signal is produced related to the concentration of a particular compound. A plot of this signal as a function of time generates a series of symmetrical peaks in a chromatogram,
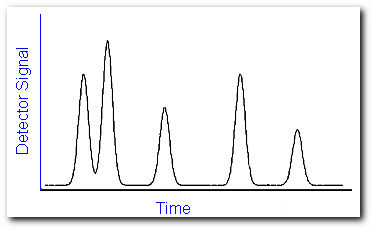
which provides some information on the sample composition. The retention time of the peaks may help identify the sample components by comparing them to the retention time of some standard, while the heights of the peaks or the area under the peaks provide a quantitative measure of the amount of each component. In theory, sample components would exit the column one by one and each peak represents a specific compound. But in reality, compounds often travel with similar speeds. This deviation from ideality will produce overlapping peaks.
Analytes are typically neutral and must be ionized for detection purposes. Methods of ion production include electron impact, which uses electrons to ionize the compounds as they elute from the GC
Here, molecular ions are formed by collision with the electron beam. This also imparts excess energy, and the ions fragment in characteristic and predictable ways. The individual fragments are detected based on their mass:charge ratio, which is usually equivalent to the molecular weight of the compound for small molecules.
Another alternative is chemical ionization. Here, a reagent gas (say methane or isobutane) is introduced into the MS at a pressure of about one torr. This moderates the energy transfer, and minimizes fragmentation. That way most if not all of the ions present in many the spectra are protonated molecular ions, and adducts with the ionization gas,
where the dot tells a free radical apart from a standard ion. This is useful in determining molecular weights, but frequently gives little or no structural information.
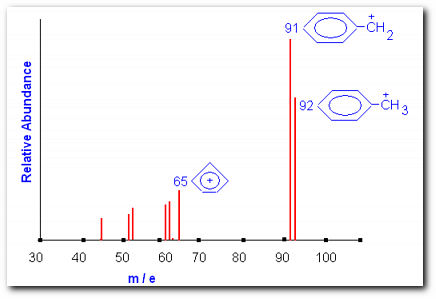
Theoretical mass spectrum of toluene. The parent ion and two fragments are shown
The figure shows a theoretical mass spectrum of toluene. The peak at m/e = 92 is the molecular ion peak M. The peak at m/e = 91 is referred to the M-1 peak. In this experiment we will be using alcohols; expect the molecular ion peak to be very weak or absent. Important fragmentation process for alcohols involves the loss of an alkyl group; the largest alkyl group is preferentially lost. Thus you can expect to observe a peak at m/e = M-A, where A = molar mass of the alkyl fragment. Another common mode of fragmentation involves dehydration. The importance of this fragmentation process increases with increasing chain length. Loss of water will generate a peak at m/e = M-18, this is very indicative of an alcohol functionality.
Both positive and negative ions are formed but only positively charged species will be detected by the mass analyzer. After the ions are separated according to their masses, they enter a detector, which sends information to the computer. Since every compound has a unique fragmentation pattern, even isomers can be differentiated by the experienced operator.
EQUIPMENT PERFORMANCE AND RELATED VARIABLES
Distribution Constants or relative rates at which the species are eluted are determined by the degree the solutes distribute themselves between the mobile and stationary phases. Distribution equilibria in chromatography defines the transfer of an analyte between the mobile and stationary phases,
where [Φ]S is the molar concentration of the analytes in the stationary phase and [Φ]M it molar concentration in the mobile phase. If K is constant over a wide range of analyte concentrations, then [Φ]S is directly proportional to [Φ]M. When this holds true, chromatographic peaks are symmetrical, Gaussian distributions and retention times are independent of the amount of analyte injected.
Retention Times of an analyte is defined as the time it takes after sample injection for the analyte to elute and reach the detector. The time for unretained species to reach the detector is defined as the dead time, The rate of migration of an unretained species is the same as the rate of motion of the mobile phase,
where L is the column length and tD is the retention time of the mobile phase. Its counterpart, the linear rate of a solute molecule is calculated by dividing the column length by the retention time tR,
The linear rate of a solute molecule can be expressed as a function of the rate of migration of the unretained species,
where ΦM(t) is the fraction of time the solute spends in the mobile phase. This fraction can be expressed as moles of solute in the mobile phase divided by the total moles of solute
where VM is the volume of the mobile phase and VS is the volume of the stationary phase. Using K = [Φ]S / [Φ]M we can obtain an equation expressing a solute migration rate as a function of its distribution constant,
That is most of what we need to know about movements of solutes through a gas chromatographic column. The efficiency of the column itself is described by the height equivalent to theoretical plates,
where N is the number of theoretical plates. Obtaining the number of theoretical plates requires some manipulation of the chromatogram,
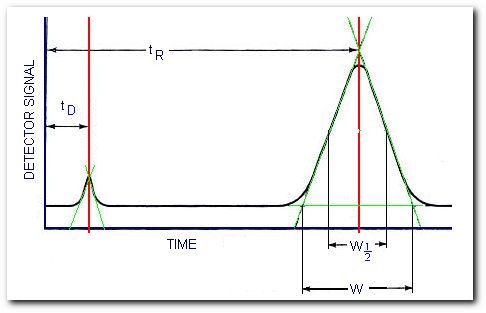
Determining the number of theoretical plates
From the figure, the number of theoretical plates is,
where W is the peak width measured in the same units as tR and W1/2 is the peak width measured at half the peak height. You can use either form of the equation.
The resolution of a column is defined as its ability to separate a mixture of compounds. For example, compounds Ψ and Θ were separated by the GC column,
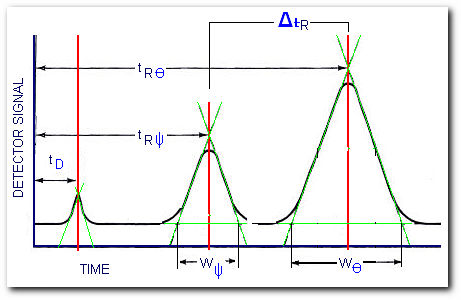
Determining the column resolution
after some manipulation of the chromatogram we get the required parameters to compute the column resolution,
The above equations have assumed Gaussian-shaped peaks, in reality, non-gaussian peak shapes will often occur. The front side of a peak might be drawn out while the tail on the right is steep. This is known as fronting and could result if too large of a sample is introduced into the column. The right side of the peak is drawn out while the tail on the left is steep. This known as tailing and usually occurs when the solute has a concentration dependent distribution coefficient. Fronting and tailing will result is less accurate quantitative analysis.
EQUIPMENT CALIBRATION
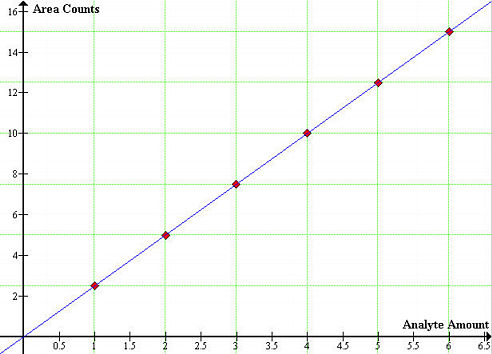
The GC-MS instrument has to be tuned before each analysis. The calibration consists of injecting a known volume of a standard and measuring the time between injection and elution. this will give the retention time of a compound and should remain the same for a given set of variables (temperature, flow rate, and column length). This is the qualitative part of the standardization process, that is, a compound can be identified in a mixture if a peak appears at the same retention time as a standard injection containing the compound. If quantitative analysis is required, we might need to compare peak heights or areas of the analyte peak with that of one of the standards. The most ancient method for quantitative analysis is the internal standard calibration method (ISTD) and involves the preparation of a series of standards that approximate the composition of the unknown. In this procedure, a measured quantity of an internal standard is introduced into each standard and sample. Chromatograms for the standards are generated and peak areas are plotted as a function of analyte amount or concentration. Such plot should yield a straight line passing through the origin,
REQUIRED MATERIALS AND APPARATUS
-Gas chromatographer-mass spectrometer
-5.0 μL Microsyringe equipped with a 20-gauge needle
-Micropipets 5 μL~1000 μL
-Vials with screw-on caps
-Normal alcohols C4~C12
-Solvents: ethanol 200% proof and DI water
-St. Pauli Girl Lager Bier Sample
EXPERIMENTAL PROCEDURE
I. HOMOLOGOUS SERIES
Prepare a standard solution of each member on the homologous series of by mixing 0.5 μL of each alcohol in 1.0 mL of ethanol. Inject 1.0 μL of each standard solution using a 5.0 μL Microsyringe. You should observe a clean separation of ethanol and the solute alcohol. In order to ensure quality and reproducibility, inject at least three samples of each solution.
Prepare a mixture of two members of the homologous series that differ by two -CH2- units and inject 1.0 μL of this mixture.
II. ANALYSIS OF GERMAN BEER
γPrepare five (or more) standard solutions of 1-10% ethanol by volume in DI water. The total volume of each solution should be ~1.0 mL.
Prepare a St. Pauli Girl Lager Bier sample.
Inject 1.0 μL of each standard solution using a 5.0 μL Microsyringe. You should observe a clean separation of ethanol and the DI water. After the standards are complete, inject 1.0 μL of beer. It is wise to make replicate injections of each standard solution and beer.
The amount of ethanol in beer varies depending on whether or not it is brewed and served following the far-reaching standards of German beers. The amount of alcohol is given as a percentage and also in 'proof'. The proof of an alcohol beverage is equal to twice the percentage of ethanol contained therein.
γAlternatively, each solution could contain a known percent by volume of one of the alcohols in the homologous series. This alcohol should have a boiling point lower than 1000C and higher than 780C. That way, the ethanol peak appear first in the chromatogram, then the other alcohol, and then the water. If using this method, the ethanol volume can be obtained from the ratio of [ethanol:other alcohol] peak heights.
DATA PROCESSING
I. HOMOLOGOUS SERIES AND EQUIPMENT PERFORMANCE
-Set the instrument to Total Ion Current monotoring mode.
-Determine tR for each member of the homologous series.
-Plot the number of carbons in the ordinate and log[tR] in the abscissa. Extrapolate to zero carbons to obtain the dead time tD.
-Determine the capacity factor k' for each member of the homologous series. This quantity is defined as:
-Determine the height equivalent to theoretical plates (HETP) from the alcohol with the largest capacity factor.
-Determine the column resolution RS from chromatograms of two members of the homologous series that differ by two -CH2- units.
II. ANALYSIS OF GERMAN BEER
Confirmation of alcohol content:
-On Total Ion Current (TIC) monotoring mode, display the St. Pauli Girl Lager Bier sample chromatogram and use the expected retention time tR of ethanol to confirm that St. Pauli Girl Lager Bier is an alcohol beverage.
-Obtain a mass spectrum of the beer's peak located at the retention time of ethanol. Then, obtain a mass spectrum of pure ethanol at the same elution time and include both spectra in your report.
-Explain how the pure ethanol chromatogram provides a fingerprint for that compound. Identify the peaks that dominate the intensity of the mass spectrum and propose a fragmentation mode for ethanol.
Measurement of alcohol content:
-For each standard chromatogram, determine the peak areas as accurately as possible.
-Calculate the ratio of the area of the ethanol peak to the area of the water peak. Prepare the standard curve of these ratios as a function of percent ethanol by volume.
-Use the standard curve to determine the percent ethanol by volume St. Pauli Girl Lager Bier. Report your answer as percent alcohol by weight, percent alcohol by volume, and 'proof'.
-Comment on the capabilities gas chromatography-mass spectrometry in terms of positive identification of particular compounds in a mixture.
THE GC-MS INSTRUMENT/SOFTWARE
Our GC-MS instrument as for 2006 is the Shimadzu's GC-17A model [Helium carrier, column lenght = 30.0 m, diameter = 0.35 μm]. A desktop PC controls the operation of the GC-MS using the CLASS-5000 software, including temperature control, mobile phase, ionization voltage, and other instrument parameters. The software includes one or more reference libraries of mass spectra that are used during the interpretation of the spectral data to help identify the constituents of the sample. The identification of unknown compounds is most accurate and dependable when only one compound at a time is presented to the detector. If two or more compounds are detected simultaneously, the ion fragmentation patterns may overlap, making positive identification difficult or impossible.
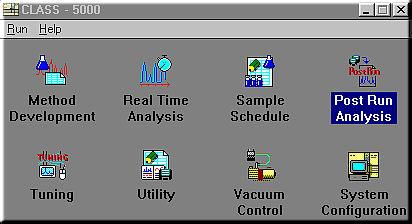
Method Development: sets the operating parameters for the GC and MS and the data processing parameters to develop methods.
Real Time Analysis: allows you to perform actual analysis while monitoring the chromatogram and operating status of the instrument. A Snapshot function enabling spectra to be analyzed and saved during analysis and a function for setting up sample schedules during analysis are also available.
Sample Schedule: perform continuous analysis of several samples. When an autosampler is configured, you may create a schedule specifying the types of samples loaded in the autosampler and their analysis parameters, so that these samples may be continuously and automatically analyzed based on that schedule.
Post Run Analysis: allows you to perform various data processing and analysis off-line on data stored on the disk.
Tuning: adjusts the MS so that analyses are performed under optimum conditions.
Utility; includes various utilities for editing method files or sample schedule files during analysis or during sample schedule execution. There are also library creation functions and functions for moving, copying, deleting and renaming the files generated by this system, and for converting file formats and backing up files.
Vacuum Control: starts and stops the vacuum system.
System Configuration: sets the operating environment for the system. This includes the system configuration, data storage locations and screen display color schemes for the GC and MS units and the data processing unit consisting of the computer system.
Most likely you will not need to use all of the CLASS-5000 functions. The ones you will be using most of the time are Real Time Analysis and Post Run Analysis. Your instructor will create a directory, it is important that you know the path to this directory so you can retrieve the files for the Post Run Analysis. Click on the Run Single button on the top of the GC window fill up the fields in the dialog box. Most fields are irrelevant, but the following are very important:
Sample ID: use a name with 8 characters or less. Use names that make files easy to identify.
Method: Click on the file icon next to the Method field and select the method. This is a [*.met] file in the directory your instructor has assigned and contains the GC-MS parameters to be used during the experiment.
Save run as: enter the name of the file that will be saved with the chromatogram data (use a name with 8 characters or less). Next to this field there is a path [for example C:\users\...]. The run will be saved in the directory specified by the path with the name you give in the Save run as field. If you do not change the filename the current run will overwrite the previous one. After everything is set up, click on "Send Parameters" and wait until the GC-MS is ready for the sample injection.
After the run is complete, you can access the Post Run Analysis Functions. Use the Browser to load and display data already stored on disk and study the data processing results. If the processing was inadequate, you can change the parameters and perform data processing over again. Use the Chromatogram Comparison to load and display two chromatograms on the screen, minimize or move one of the chromatograms, add, subtract or display a comparative chromatogram of two chromatograms and compare the peaks of the two chromatograms. Furthermore, the spectra and difference spectrum at any retention time can be displayed from individual chromatograms. The top trace is the full chromatogram showing the entire length of the run. It always shows a trace of the total ion current (TIC) and is often referred to as the total ion chromatogram (TIC). Experiment with the drag boxes and scroll bars: you can expand and offset the vertical scale of the top chromatogram with the scroll bars, you can drag a box over part of the chromatogram in the top trace and the contents will apear expanded in the zoomed in spectrum in the middle trace. When you double-click on either of the chromatograms you will see the mass spectrum recorded at the correponding time in the GC run appear in the bottom trace. You can use the scroll bar at the right of the mass spectrum to expand the vertical scale of the mass spectrum to observe and measure the abundance of weak peaks.
Library Search: Lets you compare the target spectra with records in a mass spectral library.
To perform a library search (i) Select a good quality spectrum from the the zoomed GC peak. (ii) Select Display Spectrum Search... from the Lib. Search Menu. (iii) Look for the similarity indexes that give the best hits. These may take a maximum value of 100. (iv)To compare the spectra of target and best database hit click on the Comparison button.
Beware that relying on either pattern matching alone is not adequate. Pattern matching should be combined with your understanding of the principles of fragmentation in mass spectrometry, for example, the largest m/e ratio will be equal or nearly equal to the molar mass of the target compound. If the quality of the spectrum is poor, you might want to subtract two spectra to remove interfering peaks or average them to reinforce weak peaks.
To subtract two spectra, in the Browser window of CLASS-5000 (i) Select the spectrum from which you want to subtract. (ii) Click on the subtract (Sb) button so that it is highlighted. (iii) Select the spectrum that you want to subtract from the first one.
To average two spectra, (i) Click on the average button. (ii) Select a range of scans in either the Chromatogram or Zoomed Chromatogram window.