The experimental protocol in chemical laboratories includes measurements of mass, volume, temperature, and other physical properties. These measurements are reported in either Base or Derived SI units.
Length and mass are base SI units; area, volume and density are derived SI units,
density = Mass / Volume
In order for the SI units to follow a certain pattern, the kilogram and the cubic meter are the SI units of mass and volume respectively. However, these quantities are impractical for use in chemistry. Instead, the gram and the liter are most widely used. One gram is equal to 1 X 10⁻³ kg and one liter is equal to 1 X 10⁻³ cubic meters because 1 X 10⁻³ means 1/1000.
Example on density
A 180.0 kg sample of chemical Δ has a volume of 140.0 L. Compute the density of chemical Δ in g/cm3.
First let's get the number of grams:
For the volume,
And the density,
180.0 kg X [103 g/kg] = 180.0 X 10³ g of chemical Δ
Note that the units are treated as algebraic quantities and since [kg/kg] = 1, the kg units are said to cancel.
140.0 L X [ 103 cm3/L] = 140.0 X 103 cm3 of chemical Δ
ρ(Δ) = [180.0 X 10³ g] / [140.0 X 103 cm3] = 1.286 g/cm3
Depending on the task at hand, the values to be reported might be larger or smaller than the base SI units. Such quantities are written with prefixes that represent multiples of ten. Commonly used prefixes in the chemistry laboratory are:
| PREFIX | kilo | centi | mili | micro | nano |
| SYMBOL | k | c | m | μ | n |
| POWER OF 10 | 103 | 10-2 | 10-3 | 10-6 | 10-9 |
Appropriate SI units (depending on their use) can be obtained by combining the base unit with a prefix. To change any of the resulting units of length into their equivalent values in meters use the appropriate operation and conversion factor.
Example using unit conversion
Due to the nature of the research and materials, small units are used in biotechnology. Some procedure indicates that you are to obtain 0.0500 mL of cultured cells suspended in buffer. Then add 75.0 μL of Lysozyme sulution (concentration 100 μg/mL) and 50.0 μL RNase A (concentration 500 μg/mL).
Compute (a) the total volume of the solution in liters, (b) the number of grams of Lysozyme and RNase A added (c) the mass of the entire solution in grams if its density is 1050 kg/m3.
v(cells + buffer) = 0.0500 mL X [1 L/103 mL]
v(cells + buffer) = 0.0500 X 10⁻³ L

v(Lysozyme solution) = 75.0 μL X [1 L/106 μL]

v(Lysozyme solution) = 75.0 X 10⁻⁶ L

v(RNase A solution) = 50.0 μL X [1 L/106 μL] = 50.0 X 10⁻⁶ L

v(Total) = [0.0500 X 10⁻³ + 75.0 X 10 10-6 + 50.0 X 10⁻⁶] L

v(Total) = 1.75 X 10⁻⁴ L
For the mass of Lysozyme, the units of density should match the units of volume.
mL --> L = # of mL X 10-3

μg --> g = # of μg X 10-6

100 μg/mL --> 100 [g X 10-6]/[L X 10-3] = 0.100 g/L

m(Lysozyme) = 75.0 X 10-6 L X [.100 g/L] = 7.50 X 10⁻⁶ g

m(RNase A) = 50.0 X 10-6 L X [.500 g/L] = 25.0 X 10⁻⁶ g
For the mass of solution the units density should match the units of volume. Density is often reported in g/mL for liquids and g/cm3 for solids. The two expressions are equivalent,
Some conversion factors to use at the present time are:
m3 --> L = # of m3 X 103
L --> mL = # of L X 103
m3 --> mL or cm3 = # of m3 X 106
kg --> g = # of kg X 103
To convert 1050 kg/m3 to its g/cm3 equivalent,
1050 kg = 1050 X 103 g

1.0 m3 = 1.0 X 106 cm3

1050 kg/m3 --> 1050 [g X 103]/[cm3 X 106] = 1.050 g/cm3

v(solution) = 1.75 X 10-4 L X [103mL/ L] = 0.175 mL or cm3

m(solution) = Volume X density = 0.175 cm3 X 1.050 g/cm3

m(solution) = 0.18375 ~ 0.184 g
Note that the number has been rounded off to three significant digits. In order to understand significant digits, the measurements must be recorded properly. The typical biotechnology lab includes pipets that are accurate to the nearest μL and even smaller volumes. Some instruments are very easy to use because the measuring process is automated. A digital balance for example will make measurements at the actual uncertainty of the instrument and display the correct number of significant digits. Reading the volume on a graduated cylinder takes a lot more practice. For example, there are various types of graduated cylinder of 10 mL capacity. The volume readings to be reported depend on the number of graduations per unit volume. Some cylinders have graduations at 0.1 mL intervals so they have a 0.1 mL tolerance. Volumes should be reported to the nearest tenth of mL plus one more digit. This means that the number of mL is accurately known to the nearest tenth of mL because the liquid level is either above or below one of the graduations and the next digit is an estimate. If the graduations on the cylinder are more disperse, then the cylinder has a larger tolerance value and the readings will not be as accurate.
On the other hand, a high degree of certainty required to make an object that is to be used as a standard. Such an object would have to be ground down and measured with high precision calipers to within a certain tolerance. As a rule, there is an uncertainty of one unit in the last significant digit unless otherwise specified. So the number 1.000000 m is automatically assumed to mean 0.999999 or 1.000000 or 1.000001 m.
Example on building a standard
Due to unsettled differences with France, the United States of America decides to make its own length/mass standard in the form of a Titanium-Nickel alloy bar. The longest edge of the bar will be the meter standard and has been measured to be 1.000000 m. The width and height of the bar are 0.015000 m and 0.010000 m respectively. The mass of the bar is 1.00000 kg and will be the kg standard. Calculate the percent Titanium by mass in the bar. The density of Titanium is 4.51 g/cm3 and the density of nickel is 8.90 g/cm3. Assume volume additivity.
Note that 1 mL = 1 cm3 so we can use either unit of volume.
This means that the mass of Titanium plus the mass of Nickel has to equal the mass of the alloy, here 1000 g. It is simpler to set this value equal to 1 g, we could use 1000 g and still get the same answer because we are working with relative values.
The grams cancel and the Lowest Common Denominator is (4.51 X 8.90)
v(alloy bar) = 100 cm X 1.50 cm X 1.00 cm = 150 cm3 = 150 mL
ρ(alloy bar) = 1000 g / 150 mL = 6.67 g/mL

ρ = M / V  -->  V = M / ρ

Total M / Average ρ = [M1 / ρ1] + [M2 / ρ2]
1000 g --> 1 g
M = 1 g = Total mass
M1 = &Psi = mass of Titanium
M2 = (1Ψ) g = mass of Nickel
1 g / 6.67 g/mL = [Ψ g / ρ1] + [(1-Ψ) g / ρ2]
1 g / 6.67 g/mL = [Ψ g / 4.51 g/mL] + [(1-Ψ) g / 8.90 g/mL]
0.150 mL X (4.51 X 8.90) =
Ψ X (4.51 X 8.90) (1-Ψ) X (4.51 X 8.90)
----------------- + ---------------------
(4.51) mL-1 (8.90) mL-1
6.02 mL = [(Ψ X 8.90) mL] + 4.51 mL [(Ψ X 4.51) mL]
6.02 mL - 4.51 mL = [(Ψ X 8.90) mL] [(Ψ X 4.51) mL]
1.51 mL = Ψ X 4.39 mL --> 1.51 mL / 4.39 mL = Ψ = 0.344
% Titanium by mass = 34.4 %
The rules of significant digits apply to measured quantities which are non-exact. If a number is exact then there is no uncertainty and the number of significant digits is infinite. For example people, with the exception of half-wits, come in INTEGER numbers so there can be either 10 or 11 people but not 10.5.
GRAPHICAL ANALYSIS
Suppose, we know the general shape of a mathematical function, which seeks to analyze some relationship between two quantities by performing a series of measurements. For each measurement, we set some quantity X to a chosen value and measure the corresponding value of the quantity Y and represent these two points by a coordinate pair (X, Y) on a two dimensional grid. But need to figure out where each data point is to be placed specifically, and how to divide the axes. The following are some standard steps of the graphing procedure,
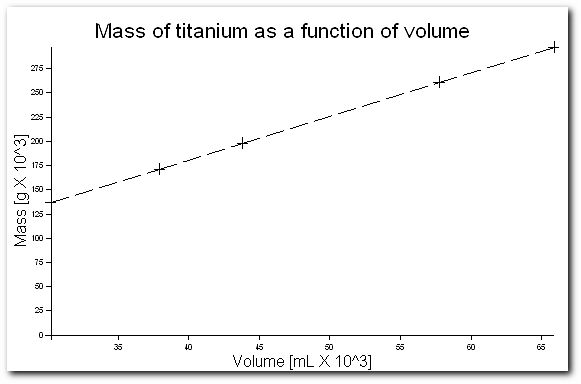
Correcting this small problem we obtain,

Note that if the axes of this graph had started at zero, only ~25% of the graph area would have been used.
External Links
THIS PAGE IS

UNLESS THE BROWSER
HAS BUGS